anomaly detection

Anomaly detection

Pinpoint your analysis of simulation results

  • 100% of runs scored, not the handful that got opened
  • <1% false alarm rate at 72.5% detection
  • <2 min from ingested DoE to a ranked anomaly list
  • 6 data modalities in one view, from one store

Your study finished. Interpreting it did not.

Meshes sit on the solver share, time histories in an object store, CAD revisions in the PLM vault, material cards in a spreadsheet, and the judgement about what counts as abnormal sits with whoever ran the baseline. Every comparison is manual and pairwise, so anomalies are found by luck and the ones nobody looked for are never found at all. Nothing tells you which runs the review missed.

This is not an engineering failure. It is an interpretation failure.

One space. Every run scored against the normal cohort.

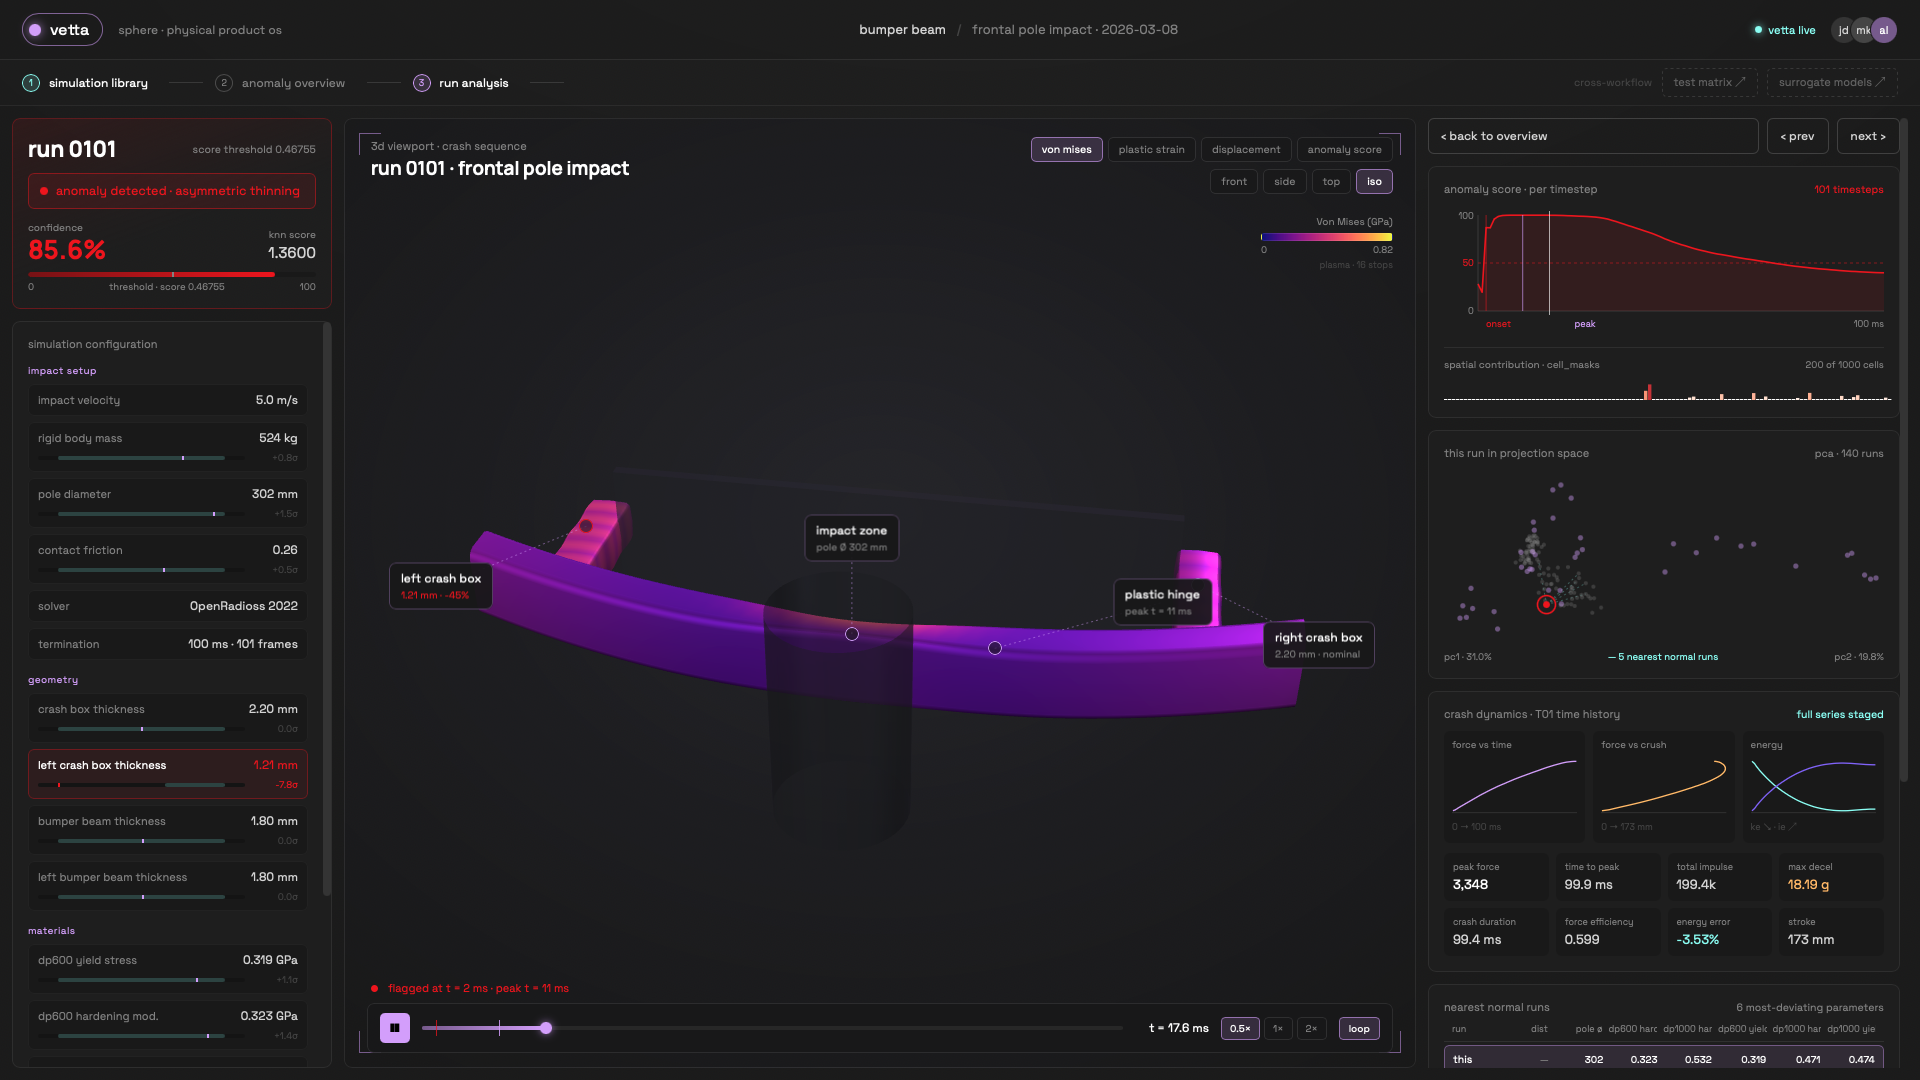
Vetta reads the whole study from your centralized data layer — stress fields, deformed meshes, time histories, DoE parameters and CAD revisions — and learns what nominal crush behaviour looks like from the clean cohort. Every run is embedded into one shared space and scored against its nearest normal neighbours, so deviation is measured rather than remembered. The engineer opens a ranked list instead of a folder tree, and each flagged run arrives with the timestep it started, the cells that carried it, and the parameter that caused it.

Find what others miss

VETTA scores every run in the study against its nearest neighbours, so deviation is measured, not recalled. The engineer gets a ranked list (timestep, cells, cause) instead of a folder tree.

features

What your team

can do with it

01

one working set from your existing stores

Wires the solver share, object store, PLM vault, test-bench channels and material library into a single working set, then loads stress fields, deformed meshes, time histories, DoE parameters and spatial masks for the whole study. Scores, embeddings and explanations are read straight from the store, so nothing is re-uploaded per analysis.

02

anomaly space across the whole study

Projects every run into one space by PCA, t-SNE or UMAP and colours it by anomaly score, cluster or failure category, so outliers, families of related failures and the boundary of the normal envelope are visible in a single frame. Detection rate is broken out per anomaly category, and the detector's own blind spots are surfaced as alerts rather than left implicit.

03

run level diagnosis in the geometry

Opens any run in the 3D viewport with von Mises, plastic strain, displacement or anomaly score mapped onto the deforming mesh across the full crash sequence. The per-timestep score marks onset and peak, and the spatial contribution overlay points at the cells that drove it, so the flag lands on a location and a moment instead of a number.

04

root cause in parameter space

Ranks the nearest normal runs by distance and shows the parameters that separate them, with each configuration value flagged against its sigma deviation from the DoE mean. A thinned crash box, an out-of-range mass or an order-of-magnitude input error is named as the cause, and the clean cohort is handed straight to a surrogate model as its training set.

Payback in months, not years

One unified engineering intelligence operating system

trained on your own simulation history, normal cohorts and failure categories, deployed securely inside your own infrastructure.

every run scored, none skipped

minutes from study to ranked anomalies

every flag traced to a timestep, a location and a parameter

run a proof of concept